Home Blogs About Us Contact Us
📞 0777 554 225 Get In Touch
📊 ERP Module

Dashboards &
Business Intelligence

Your whole business on one screen, on any device.

AccSoft ERP dashboards run in the browser, so the owner, the accountant and the sales manager see the same live figures on a desktop, a tablet or a phone. Sales, profit, bank balances, customer and supplier ageing, stock and financial ratios are drawn straight from the ledgers as they post, with no exports and no spreadsheets.

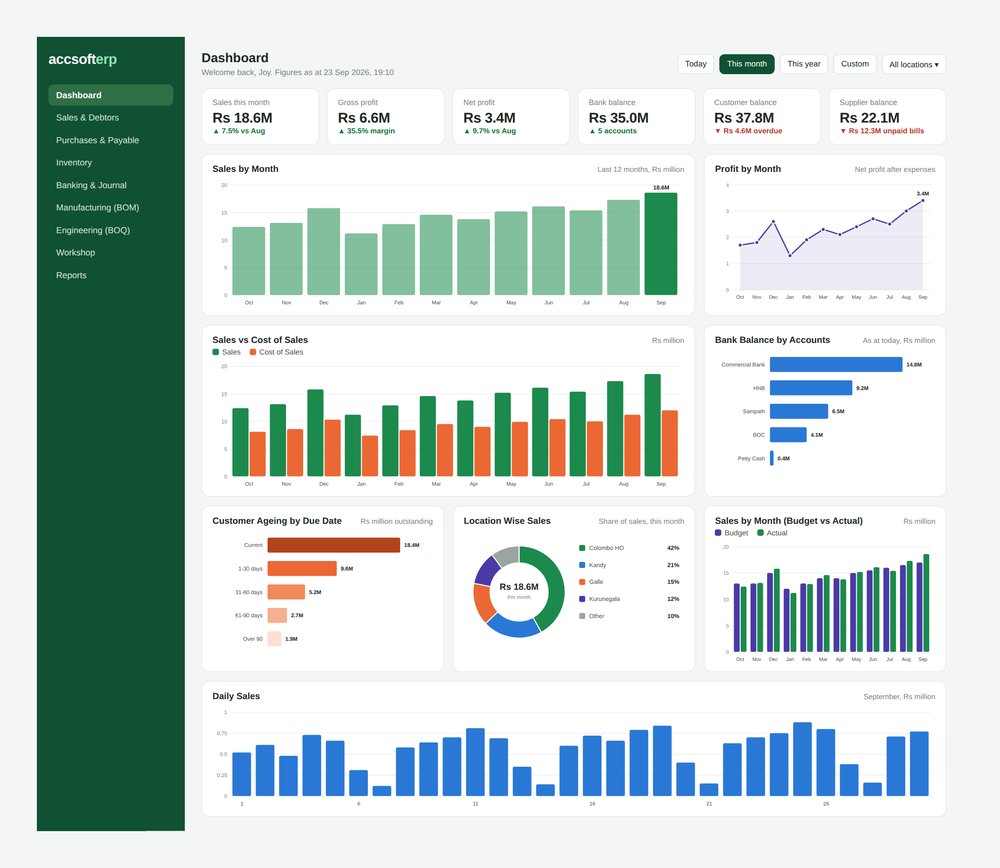
AccSoft ERP dashboard home screen with sales, profit, bank, customer and supplier tiles and graphs

The Dashboard Home Screen

The home screen answers the six questions an owner asks every morning, then shows the graphs behind them. Every figure reads live from the ledger the moment a document is approved.

📈
Sales This Month
With change against last month shown alongside.
💵
Gross Profit
Margin this month, with movement from last month.
📊
Net Profit
Bottom line this month, with movement from last month.
🏦
Bank Balance
Total across all accounts, with change from last month.
👥
Customer Balance
Total receivable with overdue portion highlighted.
📦
Supplier Balance
Total payable with unpaid bills shown separately.
AccSoft ERP dashboard home screen with sales, profit, bank, customer and supplier tiles and graphs
Dashboard home screen on desktop

Built for Mobile

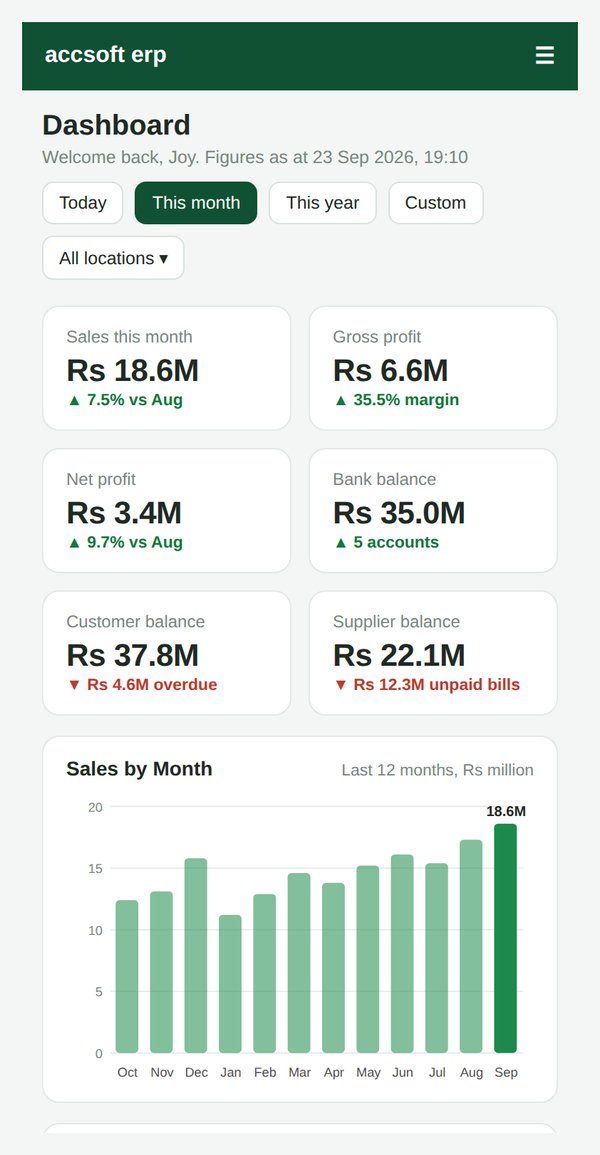
The same live dashboard on the phone in your pocket. No app to install, no separate login.

📱
Any Screen, Any Device
Six tiles across on a desktop, two on a phone, with every graph redrawn for the narrower screen rather than shrunk.
🌎
Nothing to Install
Works in Chrome, Edge and Safari on Windows, Mac, Android and iOS. Log in and the dashboard is there.
🔒
Permission Aware
Same login and user permissions as the ERP, so each user sees only the modules and locations they are allowed to.
⚡
Always Live
Figures refresh as documents are approved, so the phone shows the same numbers as the office at every moment.
AccSoft ERP dashboard on a mobile phone
The same dashboard on a phone

70+ Dashboard Graphs

Every graph responds to the same filters: Today, This month, This year or a custom range, and one location or all. Tap any bar or point to see the figure, and tap the graph title to open the underlying report.

👥
Customer 7
Customer Balance, Unpaid Invoices, Overdue Invoices, Customer Ageing by Transaction Date, Customer Ageing by Due Date, Open Quotations and Open Sales Orders.
📈
Sales 8
Customer Wise Sales, Sales Rep Wise Sales, Location Wise Sales, Transaction Wise Sales, Item Wise Sales, Sales Year Wise, Sales Month Wise and Daily Sales.
📦
Supplier 4
Supplier Balance, Unpaid Bills, Supplier Ageing by Transaction Date and Open Purchase Orders still to arrive.
📦
Stock 3
Location Wise Quantity, Item Wise Quantity and Item Wise Value, so slow and excess stock shows up before the stock take.
💸
Financial 36
Profit and loss and balance sheet as graphs, by month, by year and by account, with every line compared to budget. Includes Sales, Cost of Sales, Gross Profit, Expenses, Profit, Bank Balance, Current Assets, Current Liabilities and Equity.
📊
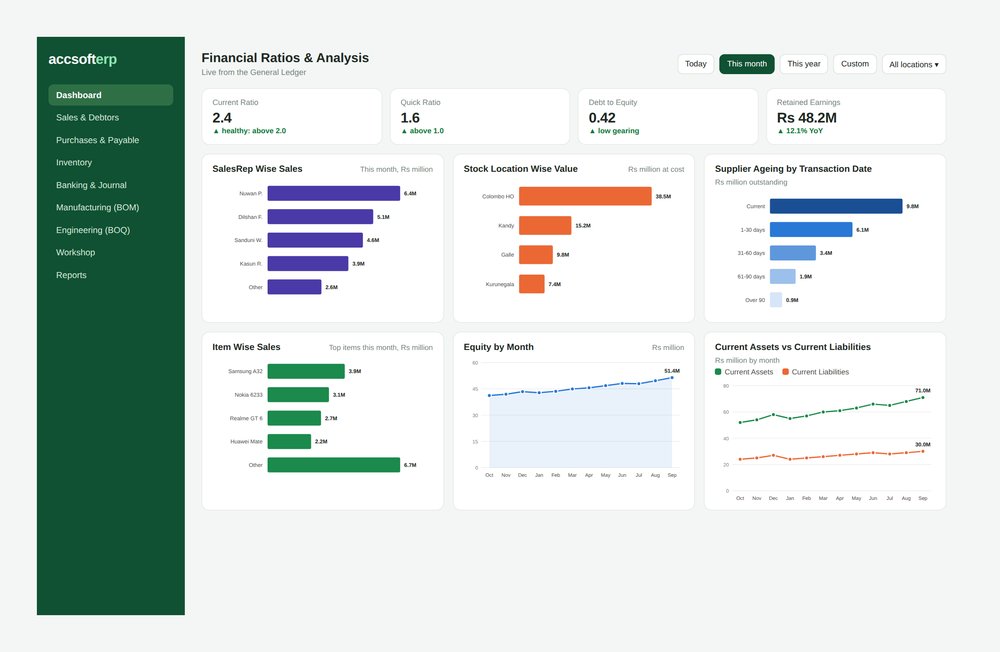
Ratios 4
Current Ratio, Quick Ratio, Debt to Equity Ratio and Retained Earnings, calculated live from the General Ledger for the bank, the board and the auditor.
AccSoft ERP financial ratios and analysis dashboard
Financial ratios and analysis page
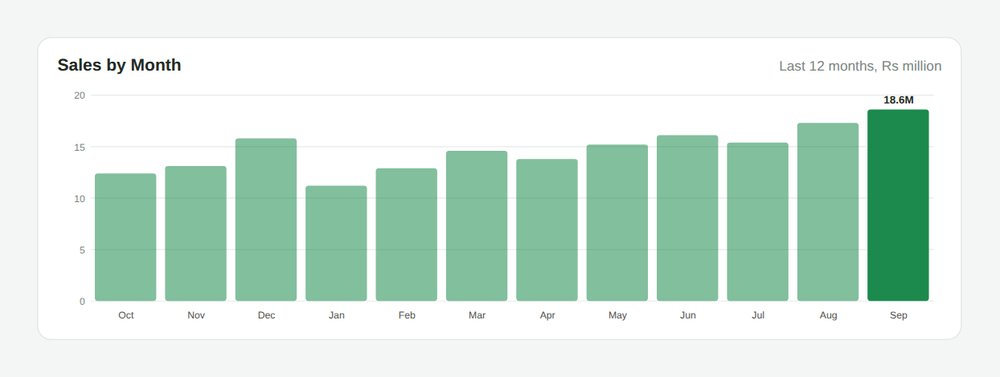
Sales by Month graph AccSoft ERP dashboard
Sales by Month
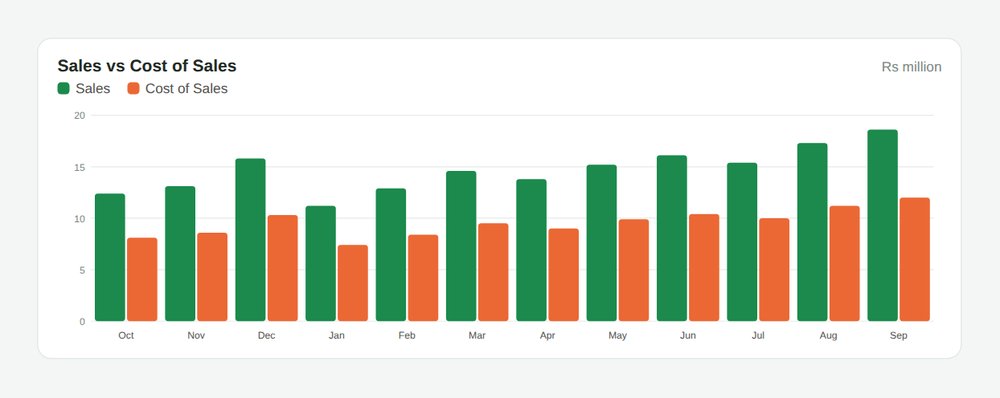
Sales vs Cost of Sales graph AccSoft ERP dashboard
Sales vs Cost of Sales
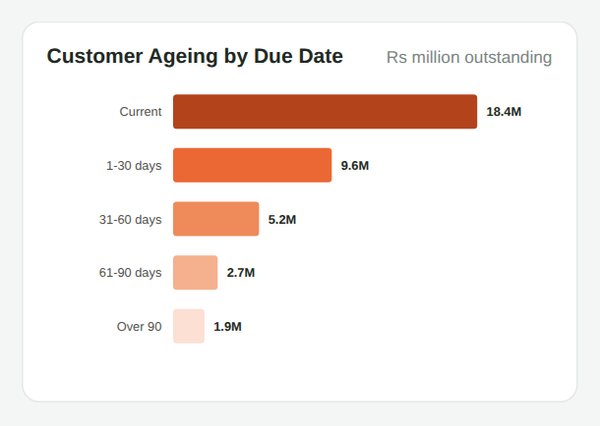
Customer Ageing by Due Date graph AccSoft ERP dashboard
Customer Ageing by Due Date
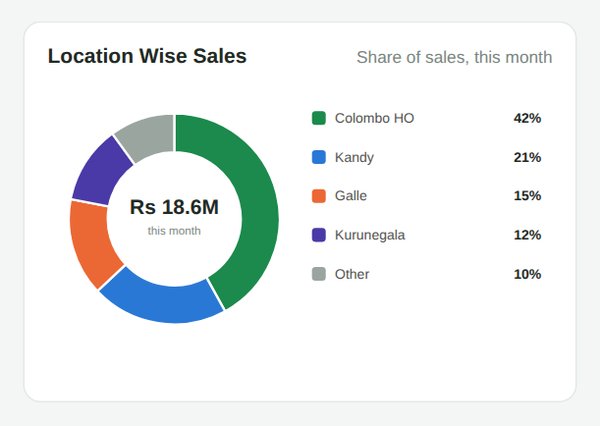
Location Wise Sales graph AccSoft ERP dashboard
Location Wise Sales
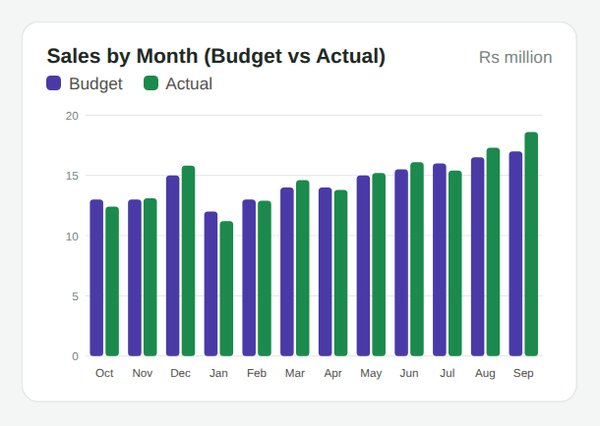
Sales by Month Budget vs Actual graph AccSoft ERP dashboard
Sales by Month (Budget vs Actual)
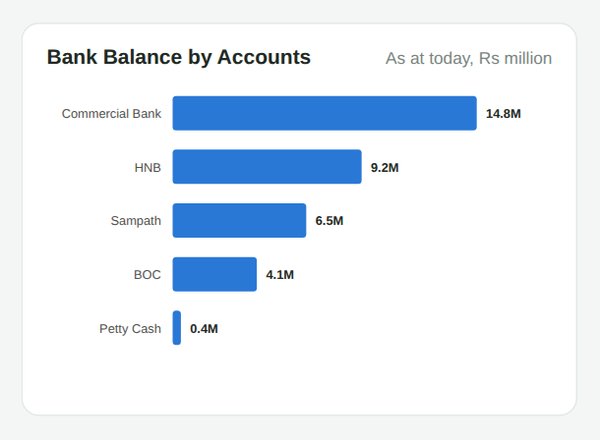
Bank Balance by Accounts graph AccSoft ERP dashboard
Bank Balance by Accounts

Why AccSoft ERP Dashboards?

Live figures, on every device, with no separate BI licence.

⚡
Live, Not Exported
Every graph reads the same ledgers the documents post to. There is no overnight batch, no download to Excel and no separate BI licence. A sale shows on the dashboard the moment the invoice is approved.
🎯
One Number Everywhere
The sales figure on the owner's phone is the sales figure in the accountant's trial balance, because it is the same figure from the same General Ledger.
📋
Budget on Every Graph
Sales, cost of sales, gross profit, expenses and profit each compare against the budget entered per account in the Cash Book and General Ledger module.
🔒
Permission Aware
A branch manager sees their branch. A sales rep sees their customers. The owner sees everything. User permissions from the ERP carry through to every graph, without any extra configuration.
📈
Familiar to QuickBooks Users
The home screen tiles and graphs follow the layout QuickBooks users already know, with the depth of a full ERP and 70+ graphs covering every area of the business.
🌟
Proven Since 1998
AccSoft Solutions has supported Sri Lankan businesses for over 25 years, with more than 5,000 active installations across every industry and company size.

Who Uses the Dashboards?

Every AccSoft ERP user, since every module feeds the same live graphs.

Owners and directors checking sales, cash and profit from the phone
Finance managers watching bank balances, ageing and ratios
Sales managers tracking reps, locations and daily sales
Purchasing managers watching supplier balances and open orders
Branch managers with a dashboard filtered to their own location
Auditors and bankers reviewing ratios and budget vs actual

Frequently Asked Questions

Common questions about AccSoft ERP dashboards.

Can I see the dashboard on my phone?
Yes. The dashboard runs in the browser and lays itself out for the screen it is on. Log in from Chrome or Safari on any phone or tablet and you see the same live figures as on the desktop. Nothing to install.
How current are the figures?
Live. Graphs read the ledgers directly, so a sale shows on the dashboard as soon as the invoice is approved. There is no overnight batch and no manual refresh needed.
Can we compare against budget?
Yes. Enter a budget per account in the Cash Book and General Ledger module and the Sales, Cost of Sales, Gross Profit, Expenses and Profit graphs each show budget against actual.
Can each user have a different dashboard?
Yes. Dashboards follow the user's permissions, so a branch manager sees their location and a sales rep sees their customers. Each user can also choose which graphs sit on their own home screen.
Which ratios are available?
Current ratio, quick ratio, debt to equity and retained earnings, all calculated from the live balance sheet in real time.
Can I drill down from a graph?
Yes. Tap a bar or point to see the value, and open the graph to reach the underlying report in the relevant module.

Explore More AccSoft ERP Modules

Every module feeds the dashboards automatically.